Home | Knowledge Base | Organizational optimization using a Data Coach
Organizational optimization using a Data Coach
The CRISP-DM(CRoss Industry Standard Processfor Data Mining) model is a methodology developed in 1996 by five major tech companies. The goal was to standardize data mining activities. The CRISP-DM methodology is still one of the most widely used analysis models for a data coach, data scientist and a data analyst. The model is set up very dynamically with the possibility to navigate between the different process steps. In practice, it is often combined with other Lean and Agile project management approaches.
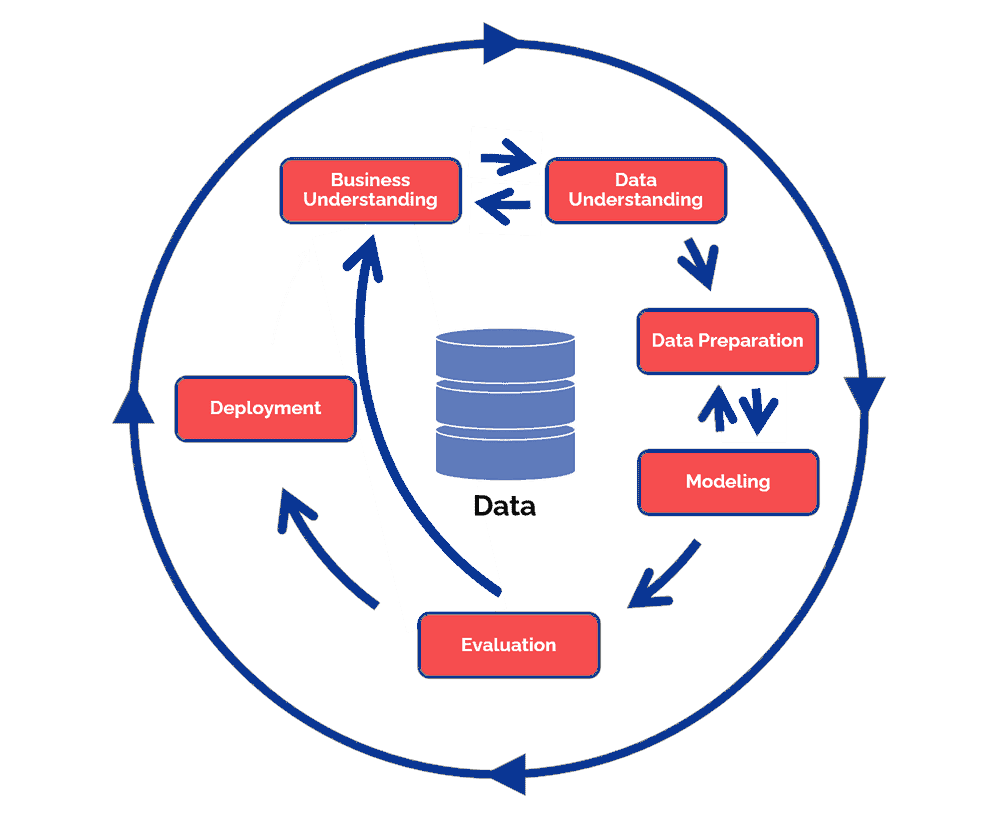
1. Business Understanding
The first phase is immediately an important one. This involves really understanding the cases. During this phase, preparatory work is done by creating a problem definition and a strategic plan for your objective. In order not to have to make a radical change of direction at a later stage, it is crucial to know what resources you want to work with to achieve your objective.
2. Data Understanding.
In this phase we dive deeper into the data. Take a good look at what data is available and whether it contributes to achieving your goals. Identifying which columns contain incorrect or missing data is of great importance because it can give a distorted picture of the situation. Defining metrics is a logical next step, when working in a large team there should be no difference in interpretation.
3. Data Coaching.
Now that you have a good understanding of the available data, the next phase is to detect columns that contain the same data but are displayed differently. For example, it could be that a column includes the height of a person but it is represented in three different units of measurement cm, m and foot. During this phase, the column is cleaned up so that there are no misunderstandings and all data meets the same requirements.
4. Modeling
In this phase, the goal is to model and transform the data in such a way that it is ready to be visualized. Often one wants to be able to observe a certain trend within a specific group or classification.
In this example, a web shop wants to measure the influence of visit duration on, for example, buying behavior. Based on this, groups of users are clustered per three minutes that they spend on the website, then it is examined whether there is any correlation between the average number of conversions that visitors from these groups achieve.
5. Evaluation
These are the phases that test whether the discoveries meet the required criteria. This is where the entire process is looked back at and how these statistics were arrived at. Here one more time is checked if there are no errors in the data preperation and modeling. When all these factors have been labeled as valid, the road can be continued to the final step, Deployment.
6. Deployment
The final phase is the deployment phase, in which one must ensure that the insights obtained are displayed in a clear manner. So that in the future data can be collected and maintained in a structured way.
Looking for Data Coaching?
Big data, Internet-of-things (IoT), Artifical Intelligence (AI), robotization, Virtual & Augmented Reality (VR/AR). All technologies that you encounter everywhere these days. Technologies that companies use, for example, to make their production process more efficient or for predictive maintenance of the machines. "These are technologies that already exist," says Wim Renders, Cluster Manager High Tech Software Cluster at Brainport Industries Campus (BIC), "But some companies don't yet know what it can do for them." Those companies Renders wants to help.
Does your organization run into issues related to the collection, storage, validation or modeling of data? Our data coach would be happy to look with you, without any obligation. Request a meeting here.